Overlays
FSLeyes refers to the files that you load as overlays. FSLeyes 1.16.1 is capable of loading the following types of data:
NIFTI image files (
.nii,.nii.gz).MGH image files (
.mgh,.mgz).GIFTI surface files (
.surf.gii,.gii).Freesurfer surface files (
lh.orig,lh.pial,lh.white, etc).TrackVis
.trkstreamline tractography files.MRtrix3
.tckstreamline tractography files.FEAT analysis directories (
.feat).MELODIC analysis directories (
.melodic).dtifit output directories.
VTK legacy files (
.vtk) which are in a format similar to that produced by the FIRST sub-cortical segmentation tool.2D image files (e.g.
.png,.bmp,.jpg, etc).
Volumetric images can be displayed in a variety of different ways, depending on the nature of the image data, and on how you want to display it. The way in which an overlay is displayed is called the overlay type or the display type. The most conventional overlay/display type for a volumetric image is the volume; the other types are described below.
Loading an overlay
You can load an overlay by doing one of the following:
The File ⇒ Add from file menu option allows you to choose a file to load (e.g. a
.nii,.nii.gz, or.giifile).The File ⇒ Add from directory menu option allows you to choose a directory to load (e.g. a
.feat,.ica, ordtifitdirectory).The File ⇒ Add standard menu option allows you to choose a file from the
$FSLDIR/data/standard/directory to load [*].The File ⇒ Add from XNAT menu option allows you to connect to, and download files from, XNAT server.
The File ⇒ Add from DICOM menu option allows you to load volumetric data from a DICOM directory [†].
The + button on the overlay list allows you to choose a file to load.
Overlay display settings
When you select an overlay, or change the type of an overlay, the contents of the overlay display toolbar will change to show commonly used display settings for that overlay. All display settings for the currently selected overlay are available in the overlay display panel.
The overlay display toolbar
The overlay display toolbar allows you to adjust basic display settings for the currently selected overlay. Some settings are available for all overlay types, whereas other settings will change depending on the type of the selected overlay.

The following settings are available for all overlay types:
Overlay display panel Clicking on the
 button will open the
overlay display panel.
button will open the
overlay display panel.Overlay information Clicking on the
 button will open
the overlay information panel.
button will open
the overlay information panel.Overlay name You can change the overlay name, as shown in the overlay list panel, here.
Overlay type You can change the overlay type here.
Opacity This slider allows you to adjust the overlay opacity/transparency.
Brightness/contrast These sliders allow you to adjust the overlay brightness and contrast.
The remaining settings will differ depending on the overlay type. For volume overlays, the following settings are available:
Reset display range This button will reset the display range to the range of the image data.
Display range These fields control the way that the image data is coloured.
Colour map You can select a range of different colour maps for colouring the image data.
-ve colour map If the negative colour map is enabled, this control allows you to choose the colour map for negative valued voxels.
Enable -ve colour map This button toggles the use of the negative colour map - for images which have both positive and negative values, positive voxels will be coloured with the standard colour map, and negative voxels will be coloured with the negative colour map.
The overlay display panel
The overlay toolbar allows you to
adjust basic display settings for the currently selected overlay. Many more
settings are available in the overlay display panel (accessed via the
![]() button on the overlay toolbar):
button on the overlay toolbar):

The General display settings section at the top contains settings common to all overlay types. The bottom section (Volume settings in this example) contain settings which are specific to the type of the currently selected overlay. The settings available for each overlay type are covered below [‡].
The overlay information panel
Clicking the ![]() button on the overlay toolbar brings up the
overlay information panel:
button on the overlay toolbar brings up the
overlay information panel:

This panel contains basic information about the currently selected overlay, such as its dimensions, file name, and transformation/orientation information.
Overlay types
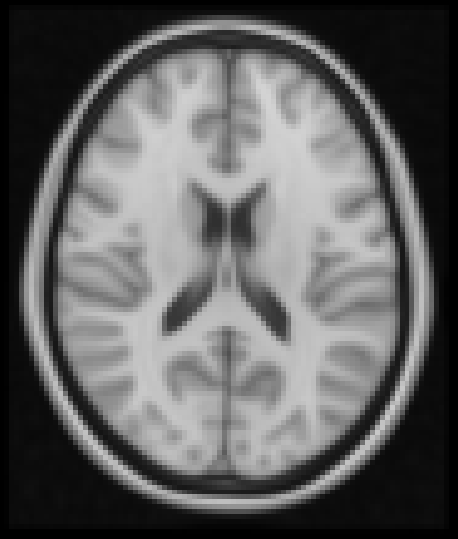
Volume
This is the default (and most conventional) display type for NIFTI images. Voxel intensities are coloured according to a colour map. The display range used to colour voxels can be adjusted, and voxels can be clipped (hidden) with an independent clipping range [§].
The following settings are available for volume overlays:
Volume If your image is 4D, you can select the displayed volume with this slider [¶].
Dimension If your image has more than four dimensinos, you can select the dimension (fourth or higher) that the Volume setting controls.
Channel If your image is multi-valued (e.g. RGB(A)), you can select the currently displayed channel. See also the RGB(A) overlay type.
Interpolation You can interpolate the image data (resampled to the resolution of your display). This is useful for generating figures, and to smooth over voxel or slice boundaries for oblique images (images which are not orthogonal to the display coordinate system). You can choose between the following options [#]:
no interpolation (equivalent to nearest-neighbour),
tri-linear interpolation,
cubic spline interpolation, or
pre-filtered cubic spline interpolation. This applies a pre-filtering function to the image data to ensure that the interpolated data has the same intensity at the voxel centres as the underlying image data.
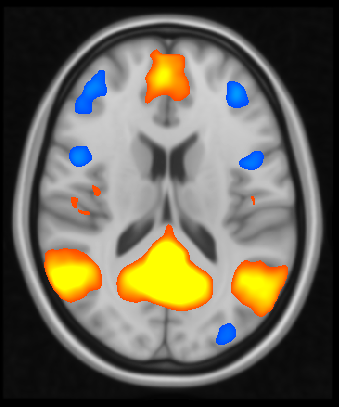
Colour map The colour map defines how voxels are coloured on the display. Voxels with an intensity equal to the low display range value will be coloured according to the lowest (left-most) colour in the selected colour map., and voxels with an intensity equal to the high display range will be coloured according to the highest (right-most) colour. You can choose from a pre-defined colour map selection, or load your own via the the Load colour map button. See the page on customising FSLeyes for more details..
-ve (negative) colour map You can apply a second colour map for images which contain positive and negative values, such as Z-statistic images, or ICA component maps. The first colour map will be applied to positive values, and the second to negative values. When a negative colour map is enabled, the display and clipping range will be applied inversely to both positive and negative values.
Colour map resolution This setting allows you to reduce the number of colours that are used in the colour map. For example, if the underlying colour map file (see the section on colour maps) contains 256 colours, and you set the resolution to 128, only half of the colours from the colour map will be used.
Gamma correction This setting allows you to apply a weighting to the display range, so that either lower or higher values will take up more of the colour range.
Interpolate colour maps This setting allows you to enable linear interpolation between colours in the selected colour map. The default behaviour (when this setting is disabled) is to use nearest neighbour interpolation.
Invert colour map This setting inverts the colour map, so that low voxel intensities are coloured with the high colour from the colour map, and vice-versa.
Invert clipping range This setting inverts the behaviour of the clipping range, so that voxels with an intensity inside the range are clipped, and those with an intensity outside of the range are shown.
Link low display/clipping ranges This setting (enabled by default) links the low display and clipping ranges, so that voxels with an intensity below the low display range value are also clipped.
Link high display/clipping ranges This setting (disabled by default) links the high display and clipping ranges, so that voxels with an intensity above the high display range value are also clipped.
Modulate alpha by intensity This setting allows you to have the transparency of voxels modulated by the voxel intensity, so that voxels with a low intensity will be more transparent, and voxels with a high intensity will be less transparent.
Clip by This setting allows you to clip the selected overlay by the voxel intensities that are in another image. When a clip by image is selected, the clipping range will be in terms of that image, not of the currently selected image.
Modulate by This setting allows you to modulate transparency of the selected image by another image, when the modulate alpha by intensity option is active. When a modulate by image is selected, the modulate range will be in terms of that image, not of the currently selected image.
Display range This setting controls how the colour map relates to voxel intensities.
Clipping range This setting allows you to hide voxels which lie outside of the range.
Modulate range This setting allows you to control the range by which transparency is modulated, when the modulate alpha by intensity option is active.
Override image data range This setting allows you to effectively override the image data range with a custom range. By default, FSLeyes sets the default display and clipping range according to the minimum and maximum values in the image. While this is suitable for most images, it is inconvenient for images which have a very large data range that is driven by outlier voxels. By overriding the image data range with this setting, you can adjust the display and clipping range limits to a range which is more sensible with respect to the data that you are viewing [♠].
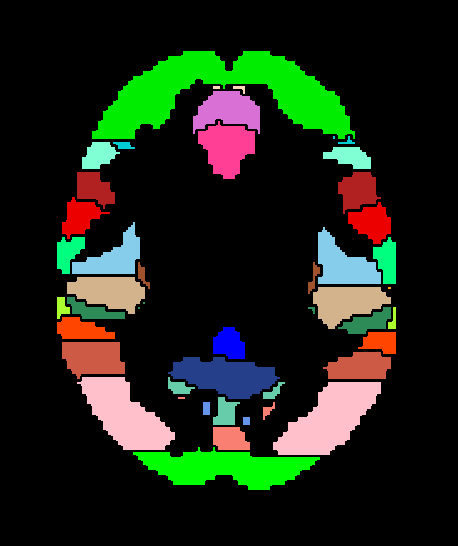
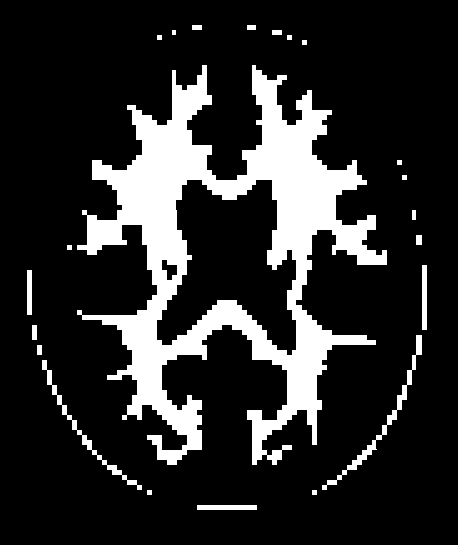
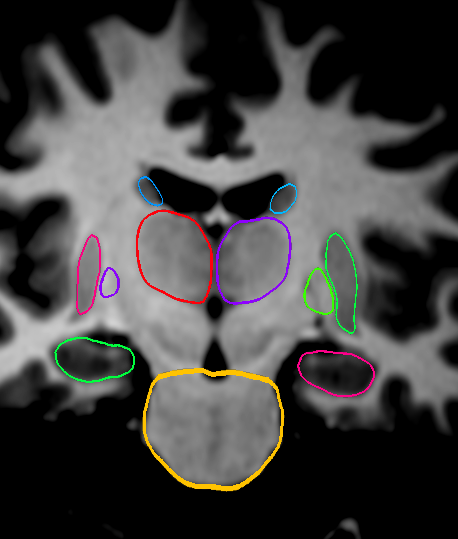
Label
This type is useful for viewing NIFTI images which contain discrete integer values (labels), such as atlases and (sub-)cortical segmentation summary images. Label overlays are coloured according to a lookup table.
The following settings are available on label overlays:
Lookup table Choose the lookup table which defines the mapping between voxel intensity and colour.
Show outline only You can choose to display label overlays with filled regions, or display region outlines.
Outline width This setting controls the region outline width.
Mask
This type is useful if you want to display an image as a binary mask. You can display any NIFTI image as a mask - not just binary images.
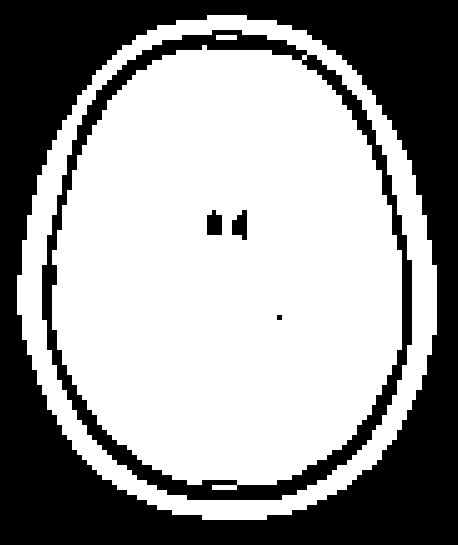

Mask overlays have the following settings:
Colour This setting controls the colour used to display the mask.
Invert This setting inverts the behaviour of the threshold setting - when enabled, voxels within the range are excluded from the mask, and vice-versa.
Threshold This range defines which voxels are included in the mask. Voxels which are within the range are included, and those outside of the range are excluded.
Interpolation This setting allows you to interpolate the mask overlay on the display.
Show outline only This setting will cause only the mask outline to be displayed (according to the current threshold), rather than showing it “filled”.
Outline width If the Show outline only option is enabled, this setting allows you to control the outline width.
Maximum intensity projection (MIP)
Selecting this overlay type enables an X-ray-like effect, where the maximum values present in the image, along a ray perpendicular to the viewing plane, is displayed. The Nudge tool can be applied to MIP overlays to give you a 3D effect.
In addition to many options shared with the volume overlay type, the following settings are available for MIP overlays:
MIP window length This setting allows you to control the window over which the MIP is calculated. It is calculated over a window centered at the current display location, and of a length specified as a proportion of the image - setting the window length to 1 will cause the MIP to be calculated over the entire image.
Minimum intensity This setting allows you to display the minimum intensity, rather than the maximum intensity.
Absolute intensity This setting allows you to display the absolute maximum intensity, rather than the maximum intensity. This setting will override the Minimum intensity setting.
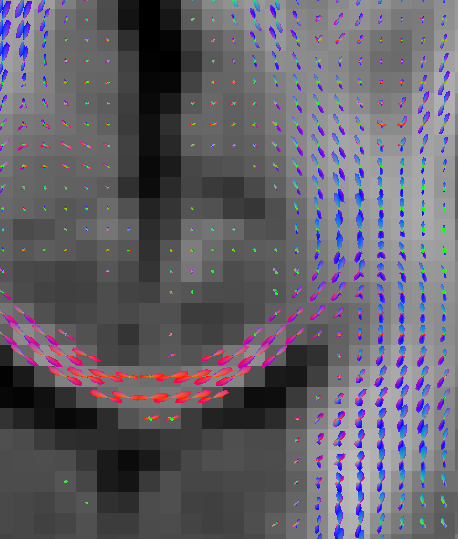
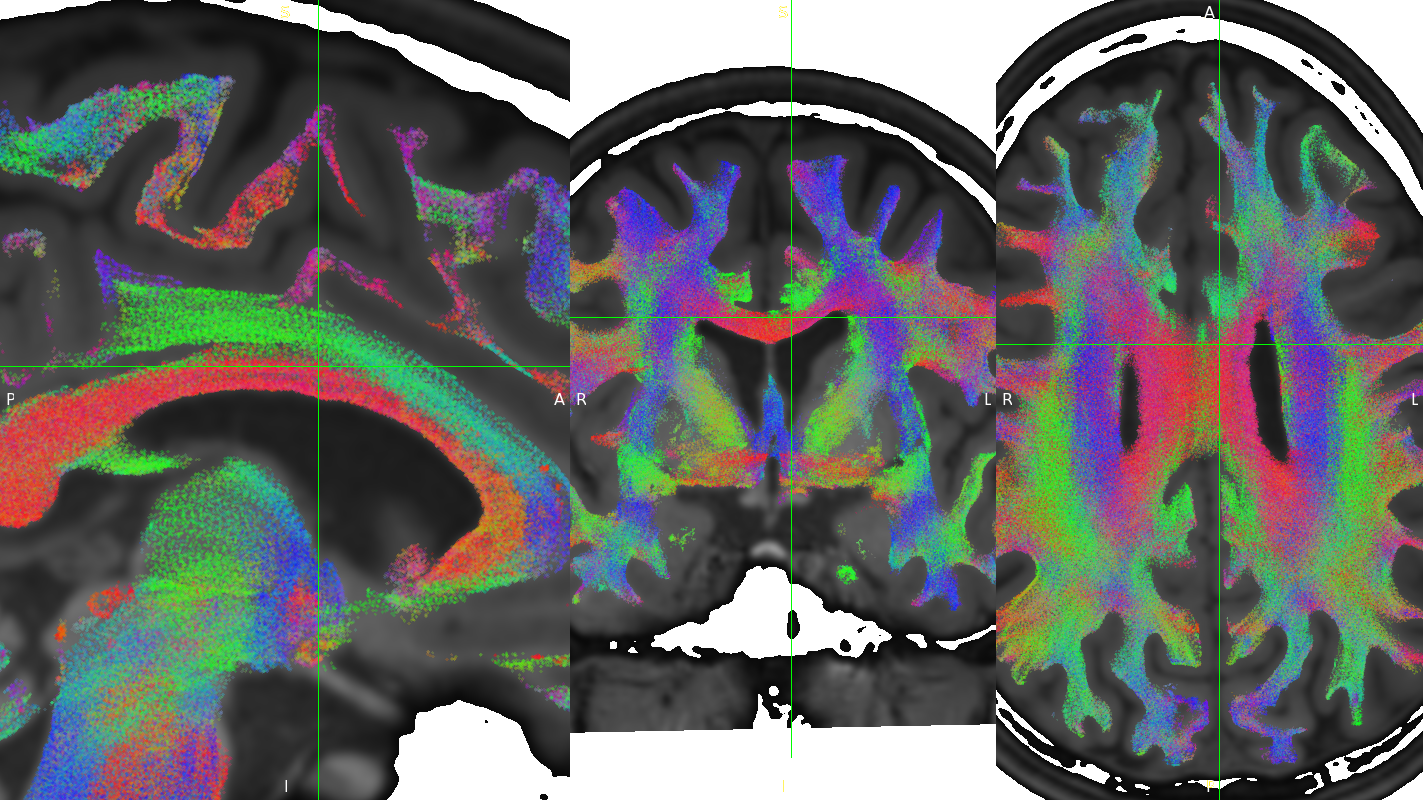
Vector
4D NIFTI images which contain exactly three 3D volumes may be interpreted as a vector image where, at each voxel, the three volumes respectively contain X, Y and Z coordinates specifying the magnitude and direction of a vector at that voxel. For example, the dtifit tool outputs diffusion tensor eigenvectors, and the bedpostx tool outputs mean principal diffusion directions, as vector images.
A vector image can be displayed in one of two ways - as a RGB vector, or as a line vector.

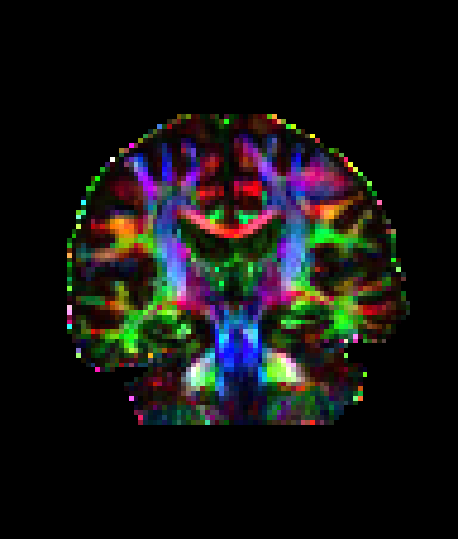

In a RGB vector image, each voxel is coloured according to the magnitude of the X, Y, and Z vector components. The default colours are (respectively) red green and blue, but these can be customised or individually disabled (suppressed). If you have another image in the same space (e.g. a fractional anisotropy [FA] or mean diffusivity [MD] map), you can modulate the brightness of the vector colours in each voxel according to the values in the other image.
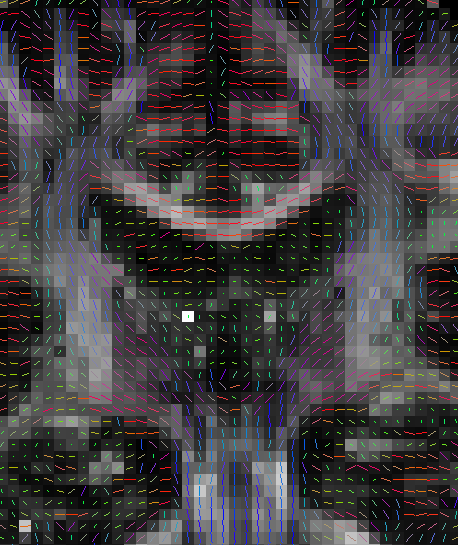
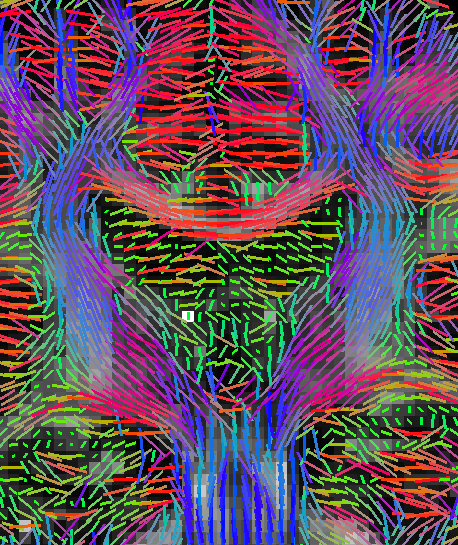

In a line vector image, the vector at each voxel is displayed as a line, and typically coloured in the same manner as for a RGB vector. Line width and length can be scaled by a constant factor, and the vector values can be displayed with varying lengths (according to their individual magnitudes), or all scaled to have the same length.
The following settings are available on vector overlays:
Colour by This setting overrides the default RGB vector colouring scheme, allowing you to colour the vector data in each voxel according to the voxel intensities in another image. This is not very useful for RGB vector overlays, but can be useful for line vectors.
Modulate by This setting allows you to modulate the brightness or transparency of the vector overlay according to the voxel intensities in another image.
Clip by This setting allows you to clip the voxels in the vector overlay according to the voxel intensities in another image.
Colour map If you have selected a Colour by image, this setting allows you to choose the colour map to use.
Clipping range If you have selected a Clip by image, this setting allows you to adjust the clipping range. The range limits are relative to the selected Clip by image.
Modulation range If you have selected a Modulate by image, this setting allows you to adjust the modulation range. The range limits are relative to the selected Modulate by image.
Modulation mode This setting allows you to choose between modulating one of brightness, transparency, line width, or line length of the vector overlay, by another image.
X Colour The colour to be used for the X vector component.
Y Colour The colour to be used for the Y vector component.
Z Colour The colour to be used for the Z vector component.
Suppress X value Suppress the X vector component - its contribution to the overall colour will be replaced according to the current suppression mode.
Suppress Y value Suppress the Y vector component.
Suppress Z value Suppress the Z vector component.
Suppression mode What to do when a component is suppressed - you can choose to replace vector components with white, black, or transparent.
RGB vectors have some additional settings:
Interpolation You can interpolate RGB vector overlays using linear or spline interpolation.
And the following settings are available on line vectors:
Interpret vectors as directed By default, FSLeyes will interpret the vectors at each voxel as undirected - the vector will be symmetric about the voxel centre. If this option is selected, FSLeyes will interpret vectors as directed - they will begin from the voxel centre, and extend outwards.
Scale vectors to unit length This setting is selected by default. When selected, FSLeyes will scale the length of each vector voxel to have a length of 1mm (or 0.5mm if the Interpret vectors as directed setting is also enabled). Otherwise, FSLeyes will not scale vector lengths. See also the Length scaling factor setting below.
L/R orientation flip If selected, line vector orientations are flipped about the X axis (which typically correpsonds to the left-right axis). This setting may be useful if you have vector data with non-standard orientation. By default, this setting is disabled for radiologically stored images, and enabled for neuroloigically stored images. See the troubleshooting section on vector orientation for more information.
Line width This setting allows you to adjust the line vector width, in display pixels.
Length scaling factor (%) This setting applies a constant scaling factor to the length of all line vectors.
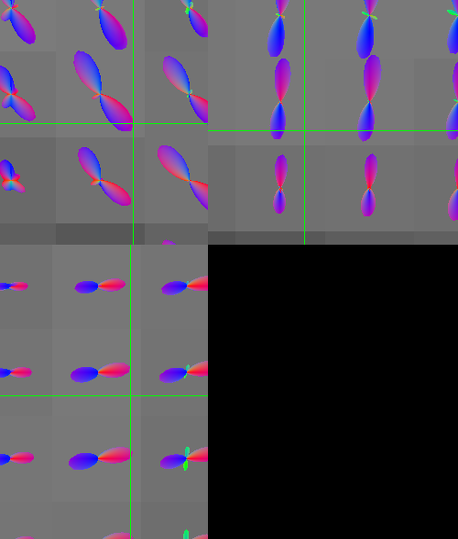
Tensor [♥]


Directories which contain dtifit output, and images which contain exactly 6 volumes (assumed to contain the unique elements of a tensor matrix at each voxel) can be displayed as tensors, where the magnitude, anisotropy, and orientation of water diffusion within each voxel is modelled by a tensor matrix, which can be visualised as an ellipsoid.
Most of the settings which can be applied to vector overlays can also be applied to tensor overlays. Tensor overlays also have the following settings:
Lighting effects This setting toggles a lighting effect on the tensor ellipsoids.
L/R orientation flip This setting flips all ellipsoids about the X (left-right) axis - see the troubleshooting section on vector orientation.
Ellipsoid quality This setting allows you to decrease/increase the ellipsoid quality (the number of vertices used to draw the ellipsoids).
Tensor size This setting scales each ellipsoid by a constant factor.
Diffusion SH [♦]
Images which appear to contain spherical harmonic (SH) coefficients for spherical deconvolution-based diffusion modelling techniques can be displayed as spherical harmonic functions.
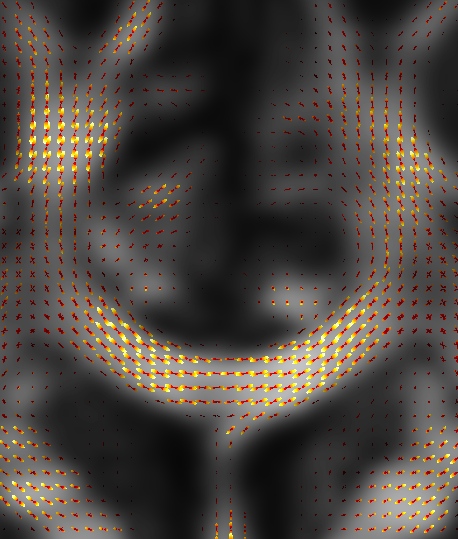
Many of the display properties which can be applied to vector overlay images can also be applied to SH images. The fibre orientation distributions (FODs) within each voxel can be coloured according to their orientation, or to the magnitude of their radius. In addition to supporting vector overlay settings, the following settings are available on diffusion SH overlays:
FOD quality This setting controls the FOD quality (the number of vertices used to draw each FOD).
Maximum SH order This setting allows you to adjust the maxmimum number of SH functions used to represent each FOD.
L/R orientation flip This setting flips all FODs about the X (left-right) axis - see the troubleshooting section on vector orientation.
Lighting effects This setting toggles an FOD lighting model [♣].
Normalise FOD sizes This setting normalises the size of each FOD to be the same. This is useful for data which contains extreme values.
FOD size This setting allows you to scale the size of each FOD by a constant factor.
Radius threshold This setting allows you to clip FODs which have a small maximum radius.
Colour mode You can choose to colour FODs by direction, or by the magnitude of their radii.
RGB(A)
FSLeyes is able to display NIFTI images which contain RGB(A) data, and can
also load 2D bitmap files (e.g. .png, .bmp, .jpg, etc). When you
load such a file, it will by default be displayed as a volume overlay, but you can change the overlay type to 3D/4D RGB(A) volume
to display the image data in its native colouring.
The following settings are available on RGB(A) overlays:
Interpolation You can interpolate RGB(A) overlays using linear or spline interpolation.
R Colour The colour to be used for the R channel.
G Colour The colour to be used for the G channel.
B Colour The colour to be used for the B channel.
Suppress R value Suppress the R channel - its contribution to the overall colour will be replaced according to the current suppression mode.
Suppress G value Suppress the G channel.
Suppress B value Suppress the B channel.
Suppress A value Suppress the A channel.
Suppression mode What to do when a channel is suppressed - you can choose to replace channels with white, black, or transparent.
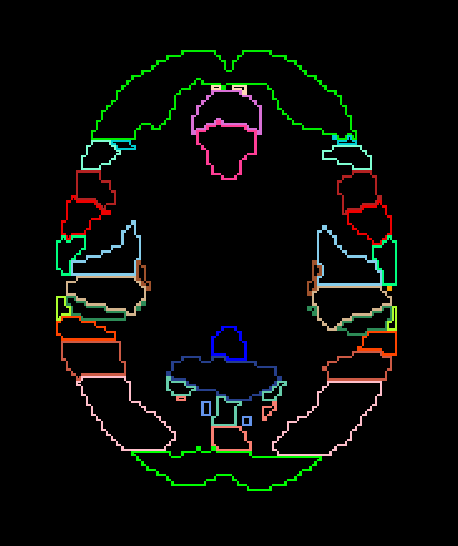
Mesh
FSLeyes is able to display 2D cross sections of 3D triangle meshes (see here for details on viewing volumes in the 3D view).

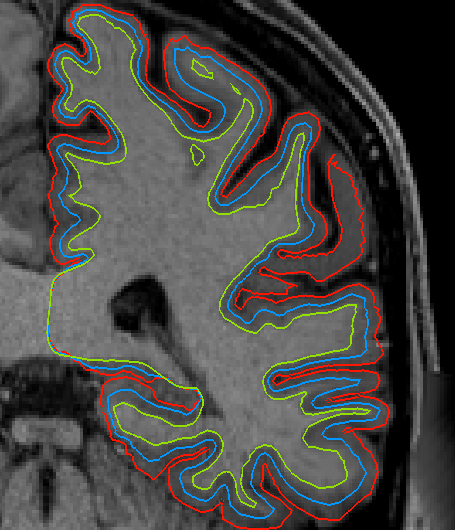
FSLeyes can display 3D triangle mesh data loaded from:
GIFTI files which contain surface data (a
NIFTI_INTENT_POINTSETarray containing vertices, and aNIFTI_INTENT_TRIANGLEarray containing triangles [**].Freesurfer surface files.
VTK legacy files which specify a triangle mesh in the
POLYDATAdata format. Files of this type are generated by the FIRST sub-cortical segmentation tool, to represent sub-cortical structures.
On orthographic and lightbox views, FSLeyes displays cross sections through the model along planes perpendicular to the X, Y, and Z axes.
Many of the display settings for volume overlays are also available for mesh overlays. Mesh overlays have the following additional display settings:
Reference image This setting allows you to choose the NIFTI reference image associated with the model (see the sidebar).
Coordinate space This is an advanced setting which allows you to specify how the mesh vertex coordinates are defined, relative to its reference image. FSLeyes will try to guess the correct coordinate system when it can, but you can explicitly change this setting if needed. The options are:
World coordinates - The mesh coordinates are defined in the reference image world coordinate system (as defined by its
sform/qform).Scaled voxels - The mesh coordinates are defined in the reference image voxel coordinate system, scaled by the voxel
pixdims.Scaled voxels forced to radiological convention - The mesh coordinates are defined in the reference image voxel coordinate system, scaled by the voxel pixdims. If the reference image transformation matrix (
sform/qform) has a positive determinant, the X axis is flipped.Voxels - The mesh coordinates are defined in the reference image voxel coordinate system.
Freesurfer coordinates - The mesh coordinates are defined in the Freesurfer Torig / vox2ras-tkr coordinate system.
Show outline only You can choose between showing the filled mesh, or showing just its outline.
Outline width If the Show outline only setting is enabled, this slider controls the outline width.
Colour The colour to use for the mesh.
Surface definition If there are multiple definitions for your mesh (e.g. a white matter mesh, pial mesh, and mid-thickness mesh), this setting allows you to select the surface definition to use.
Vertex data You can use this setting to select some data associated with the mesh vertices (either plain .txt files, or .func.gii, .shape.gii, .label.gii, or .time.gii files for GIFTI overlays). You may then colour and clip the mesh according to this data (only when showing the mesh outline), using the same properties that are described for volume overlays.
Vertex data index If you have selected some 4D vertex data, this setting allows you to control the data volume that is displayed.
Lookup table If you have selected some categorical vertex data, you may use this setting to colour the mesh according to a lookup table instead of a colour map.
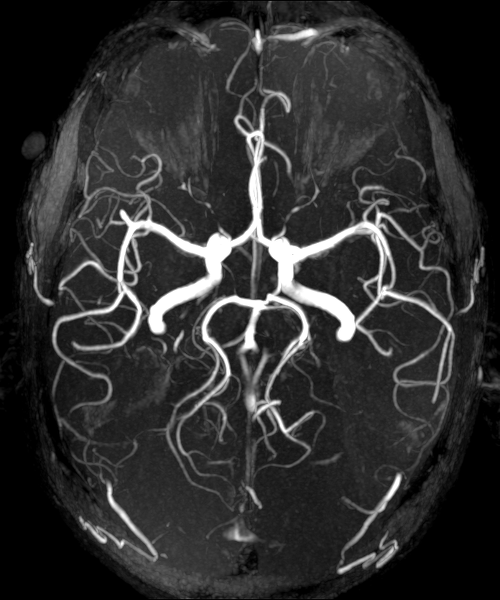
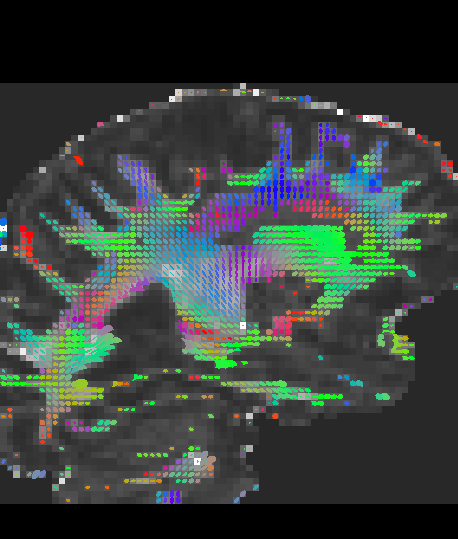
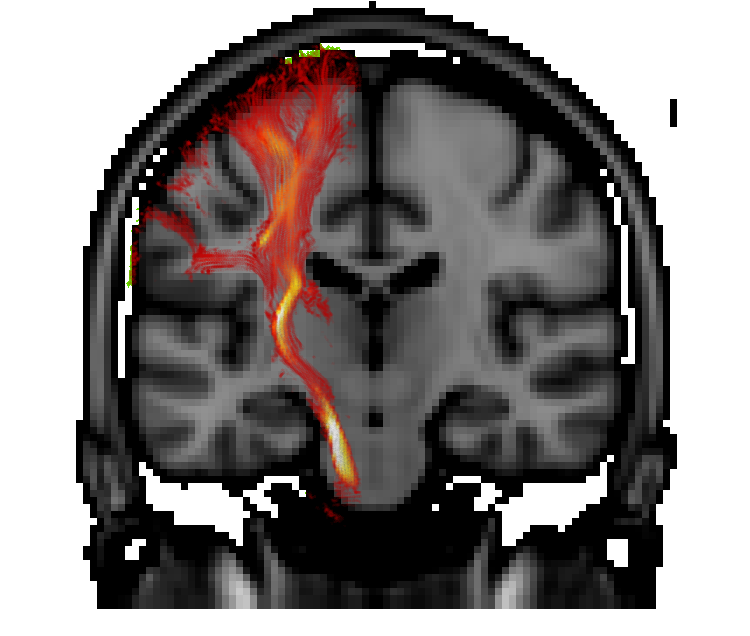
Tractogram
FSLeyes can display TrackVis .trk and MRtrix3 .tck streamline tractography (tractogram)
data sets. In the ortho and lightbox views, a 2D cross-section of the
streamline vertices at the current location is displayed. Tractograms can also
be visualised in 3D - see here for more details.
Data for some of the examples above was sourced fromn the B.A.T.M.A.N. - Basic And Advanced Tractography with MRtrix for All Neurophiles data set, created by Marlene Tahedl and released under a CC-By Attribution 4.0 International license (DOI 10.17605/OSF.IO/FKYHT).
The overlay display settings dialog (the ![]() button) has several
options allowing you to control how tractograms are displayed.
button) has several
options allowing you to control how tractograms are displayed.
The Width option controls the diameter of each streamline point. The Resolution option allows you to control the quality - at lower resolutions, points are drawn as triangles or squares, whereas at higher resolutions they are drawn as circles.
The Sub-sample option allows you to reduce the number of streamlines drawn to improve performance - a random selection of streamlines will be drawn. This option is automatically scaled down for large tractograms, but can be manually increased if desired.
By default FSLeyes displays individual streamline vertices which are near the current depth position. The Pseudo-3D checkbox causes FSLeyes to display the full 3D tractogram, overlaid on the 2D view.
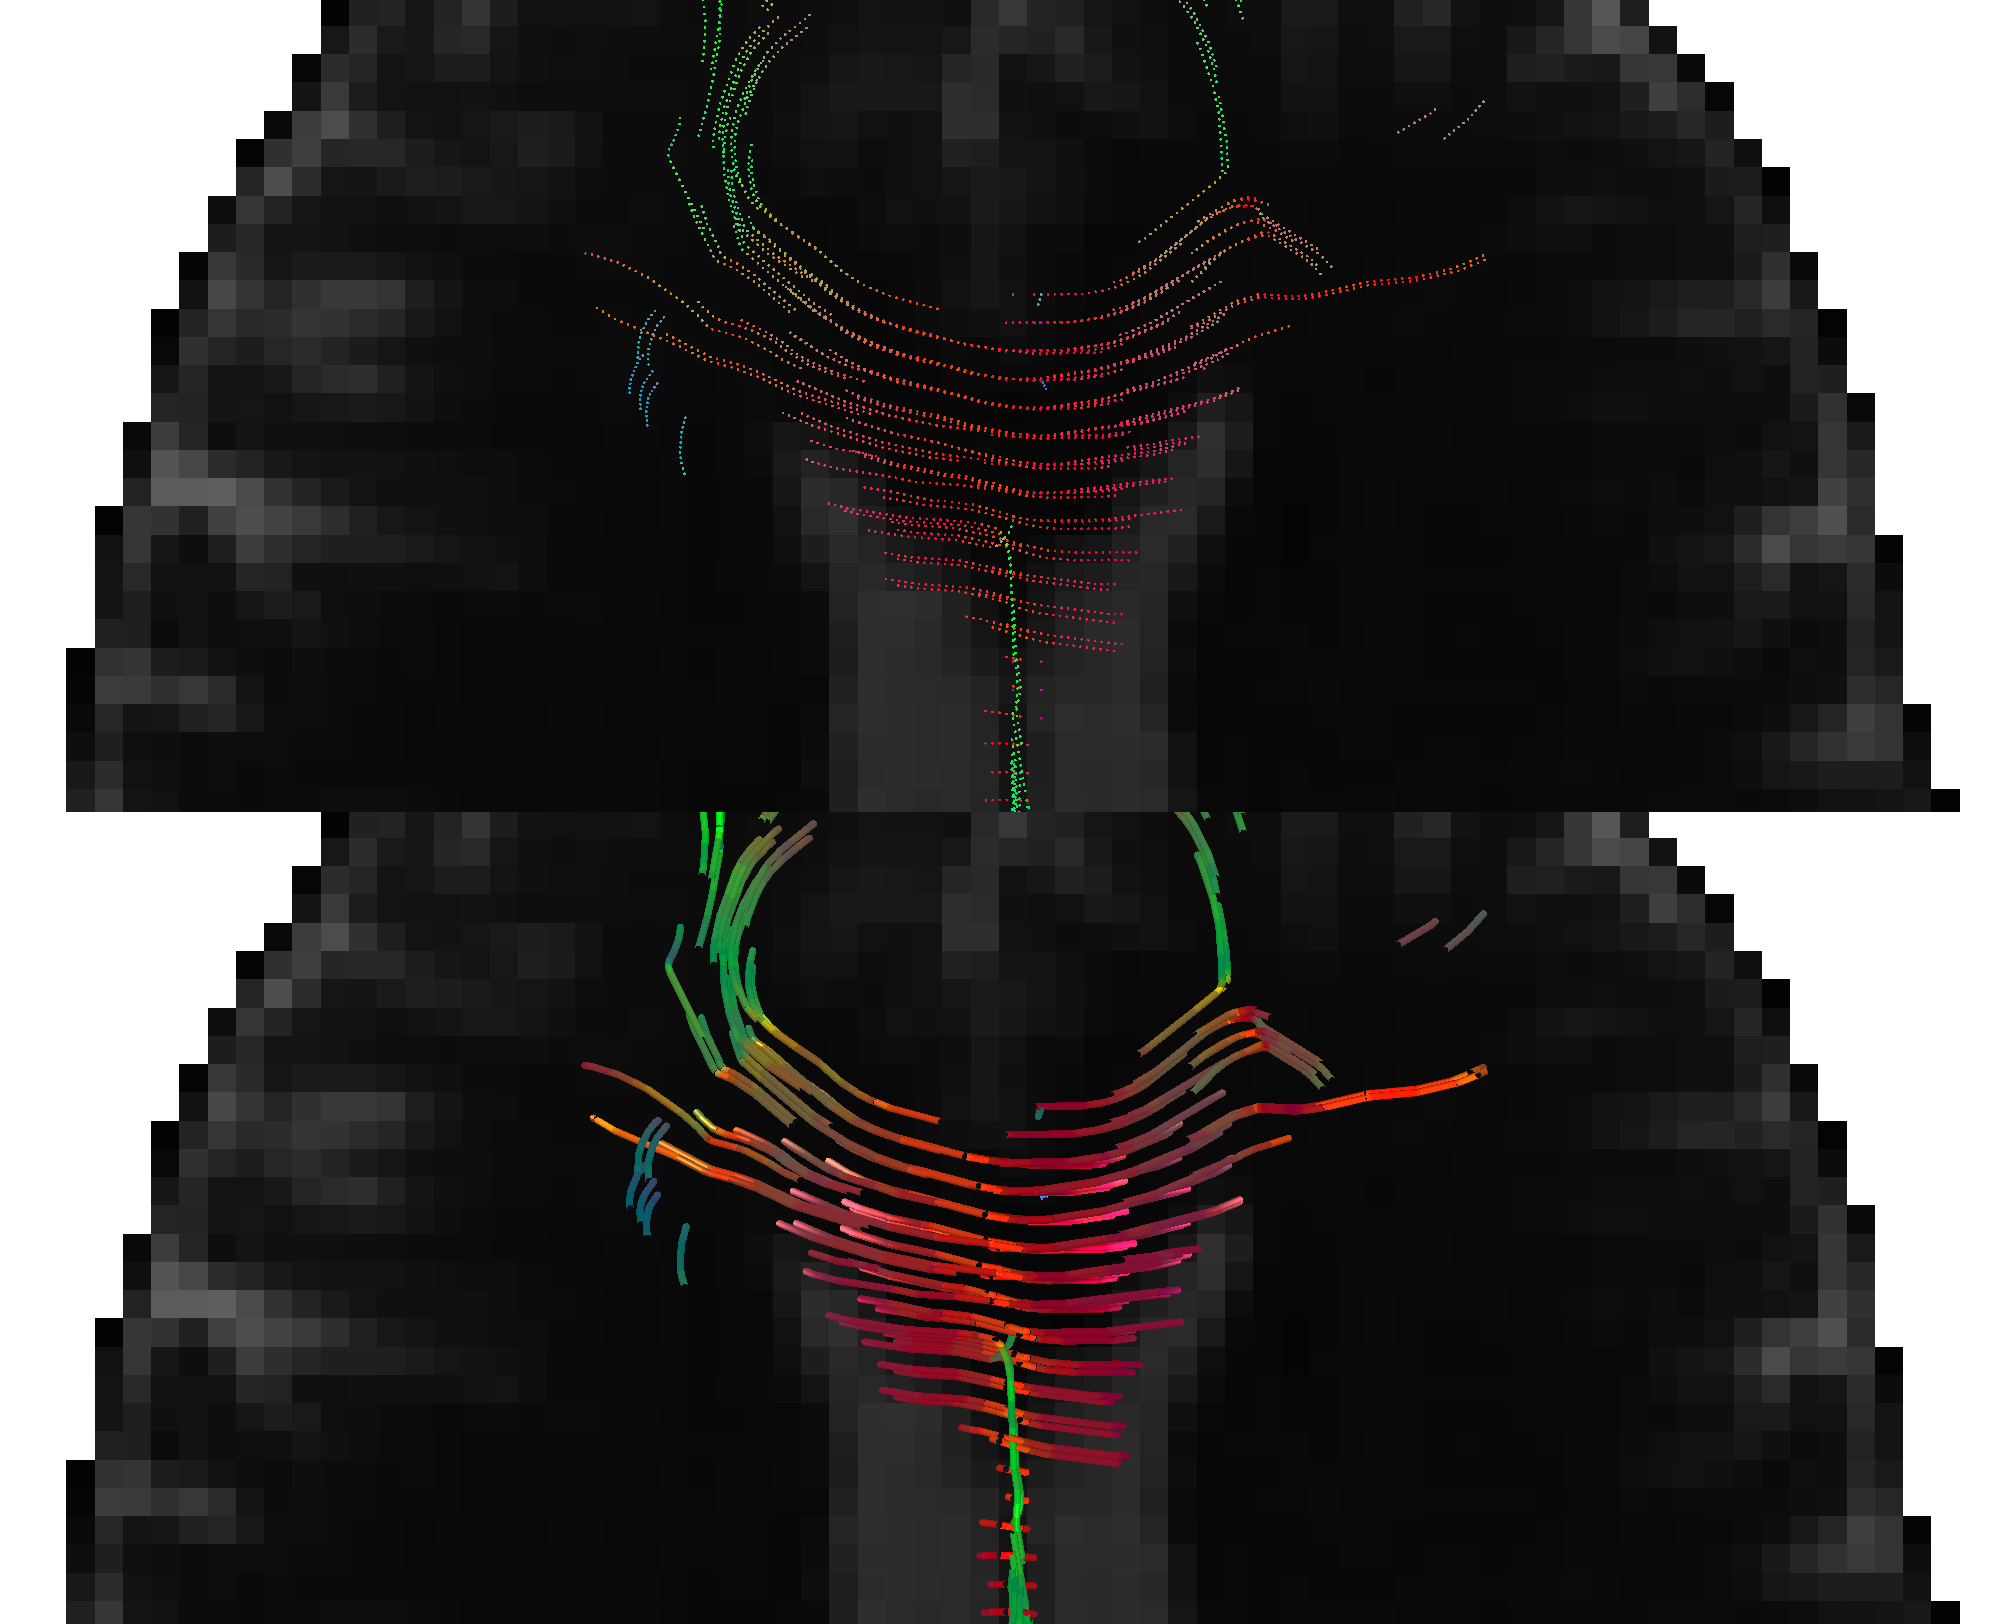
When displaying tractograms with the Pseudo-3D option, the Depth clipping options allow you to show or hide regions of the tractogram independently on each axis:
Show slice only displays regions of the tractogram around the current depth position.
Show above only displays regions of the tractogram above the current depth.
Show below only displays regions of the tractogram below the current depth.
Show all displays the full 3D tractogram.
The Colour by option allows you to control how a tractogram is coloured. Streamlines can be coloured in one of three ways - the default setting is to colour them according to their XYZ orientation. The colours that correspond to each of the XYZ directions can be changed, in the same manner as for vector images.
Streamlines can also be coloured by per-vertex/per-streamline data sets, either stored in the tractogram file itself, or loaded from a separate data file (click on the Load vertex data button to load data from a separate file). Finally, streamlines can be coloured by the values in a separate NIfTI image.
When colouring streamlines according to a data set or image, the usual options are available to control colouring, including choosing a Colour map, controlling the Display range, and modulating transparency by the data.
The Clip by option can be set independently of the Colour by option, and can be used to clip/hide streamlines according to the data set, and Clipping range that you specify.
The Reference image option allows you to associate a tractogram with a NIFTI reference image - if you set this to the image from which the tractogram was generated (or any image in the same space), FSLeyes will be able to correctly position the tractogram in the display coordinate system. By default FSLeyes assumes that tractogram vertices are defined in world coordinates, but this can be changed via the Coordinate space option.