Tools
The FSLeyes Tools menu contains a range of tools to perform various types of processing and analysis on your data. The Tools menu is organised into one or more sections:
A section which contains tools that are always present, and independent of any open view.
One section for each open view - some views have no tools associated with them, so will not appear in the tools menu.
General tools
FSLeyes provides a selection of tools which allow you to manipulate the currently selected overlay.
FLIRT/affine transformations
The Load affine transformation tool allows you to load an affine transformation from a text file and apply it to the currently selected image.
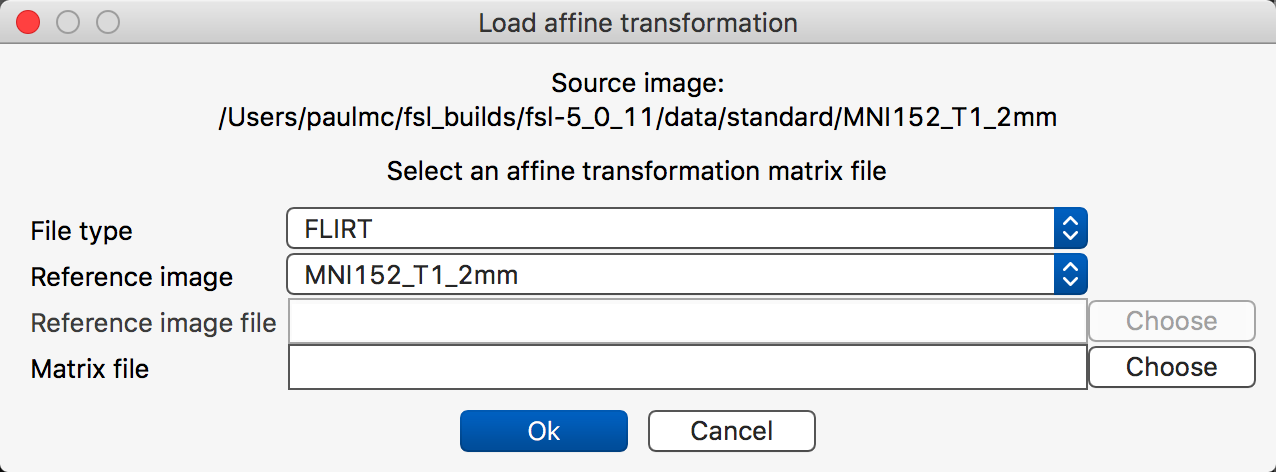
The File type setting allows you to select the type of affine matrix you wish to load:
A FLIRT matrix is an affine transformation produced by the FLIRT linear registration tool. A FLIRT matrix encodes a transformation from a source image to a reference image, where both the source and reference image spaces are in a scaled-voxel coordinate system, possibly with an inversion about the first (left-right) voxel axis. More information on FLIRT matrices can be found here.
A voxel-to-world matrix is an affine matrix which encodes a transformation for a single image, from voxel coordinates into world coordinates.
If you are loading a FLIRT matrix, you must specify a reference image. You can use the Reference image drop-down box to select one of the images currently loaded in FSLeyes. Or, if you choose Select file manually, you can select an image from the file system.
The Export affine transformation tool allows you to save the affine for the currently selected image. This is useful if you have used the Nudge tool (covered below) to manually adjust the affine for an image.
Resample image
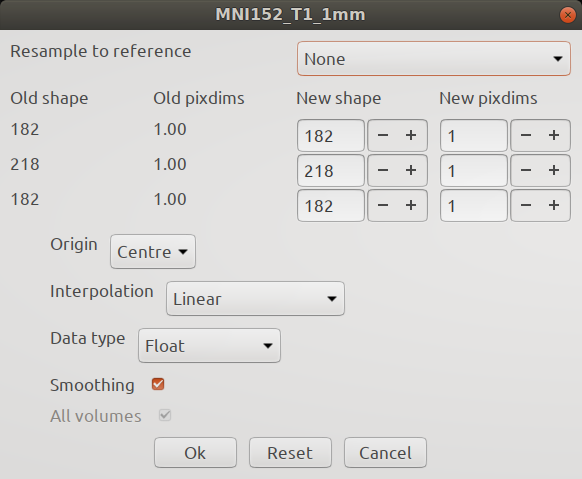
The Resample image tool allows you to resample the currently selected image to a different resolution. You can specify a desired shape via the New shape inputs, or a desired voxel resolution via the New pixdims inputs. Or you can resample one image into the space of another using the Resample to reference option.
The Interpolation option allows you to choose different interpolation options to use during the resampling. If you are resampling a binary mask, you will likely want to select Nearest neighbour interpolation.
You can also specify the output Data type, and apply Smoothing to the resampled image.
Project image onto surface
This tool is available when the currently selected overlay is a mesh. If you have an image with some data that you would like displayed on the mesh, you can select this option to project the volumetric data from the image onto the surface of the mesh. The image and the mesh are assumed to be aligned in the display coordinate system
Ortho view tools
The ortho view has a number of interactive tools for editing and adjusting NIFTI images. The Edit mode option is covered in the page on editing NIFTI images.
Crop image
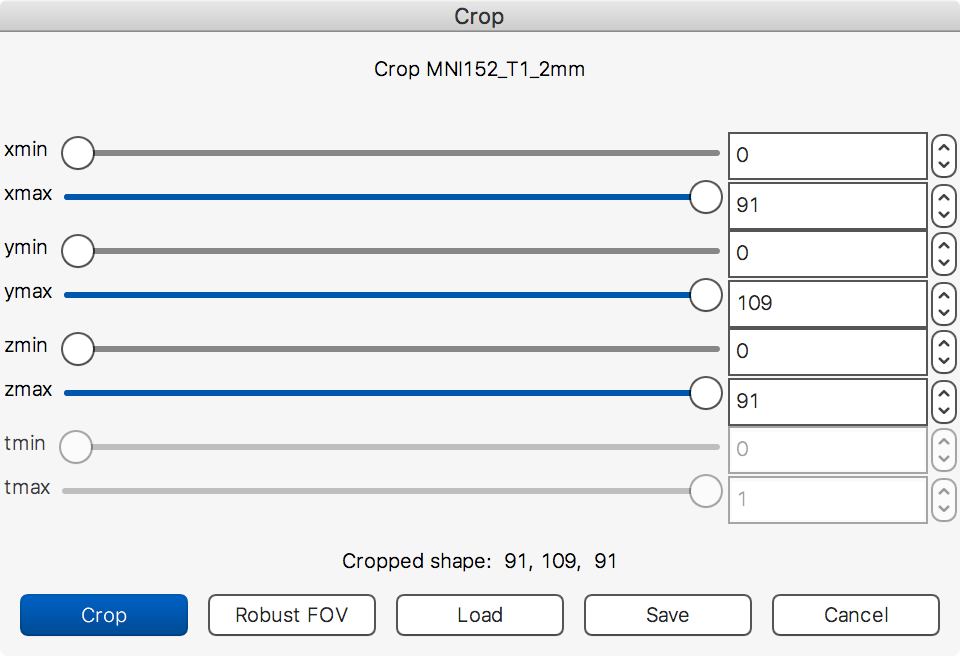
The Crop image tool allows you to manually crop an image - it is
essentialy an interactive version of the fslroi command-line tool.
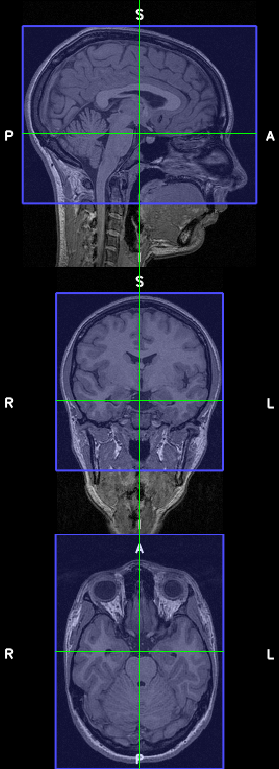
When you select the Crop image tool, a blue overlay will appear on the ortho view. You can click and drag on the ortho canvases to adjust the region that will be cropped. You can also use the sliders in the crop image dialog box to adjust the cropping region.
If FSL is installed, clicking the Robust FOV button will run the
robustfov command-line tool - this tool estimates a good cropping region
for images with a large field-of-view.
When you are happy with the region, click on the Crop button to create a cropped copy of the image. You can then select that image, and save it out to a file.
The Save and Load buttons allow you to save and load cropping
parameters to/from simple text files. The format used in these text files is
equivalent to the parameters that would be passed to the fslroi
command-line tool.
Adjust image transform (a.k.a. Nudge)
The Nudge tool allows you to adjust the affine transformation of a NIFTI image. This can be useful if you need to manually register one image to another, if you need to fine-tune a previously calculated linear registration, or if you simply wish to view some image data from a different angle.
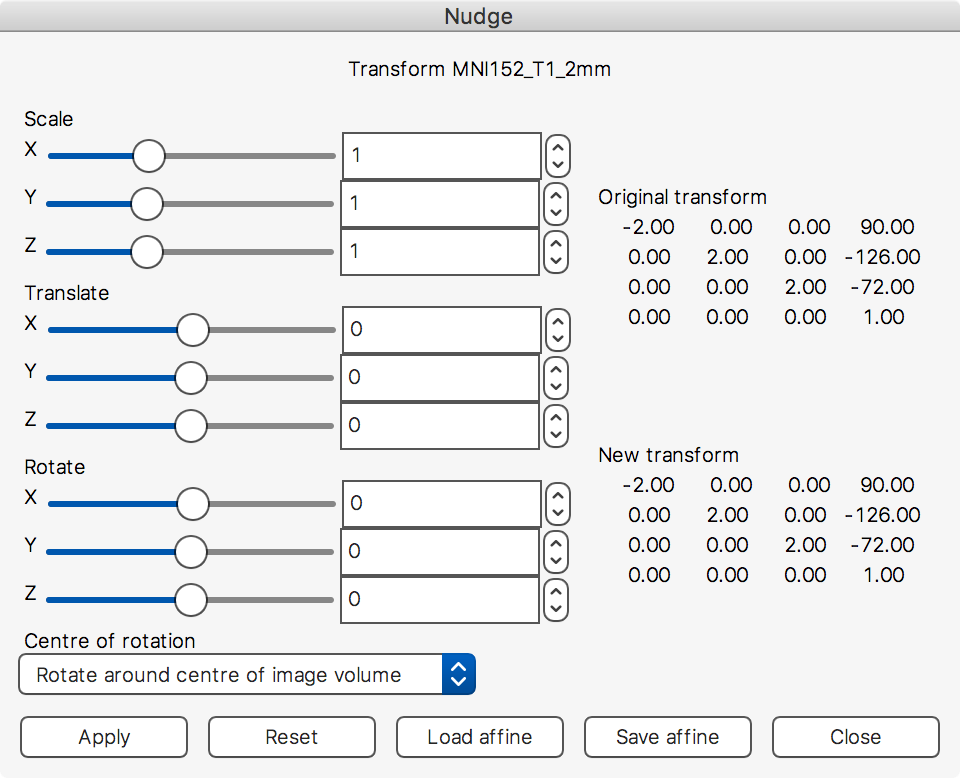
The three sets of sliders allow you to apply scalings, translations, and rotations to each of the three image axes. The Centre of rotation drop-down box can be used to set the centre of rotation to either the image centre, or to the current display location.
The Load affine and Save affine buttons allow you to load a transformation from a file, or save the current transformation to a file (see the section on FLIRT/affine transformations, above).
Once you are happy with your adjustments, click the Apply button to apply it to the image. You may then need to save the image to file, to make your adjustments permanent.
Sample along line
The Sample along line tool allows you to plot data along a straight line through a 3D NIFTI image.

After opening the Sample along line dialog, simply click and drag across one of the ortho view canvases. When you release the mouse button, the voxel intensities from the currently selected image are sampled and plotted.
If you draw another line, the data is discarded, and values from the new line are sampled and plotted. The + button allows you to save the current data so that it is kept on the plot, which allows you to plot data from multiple lines. The - button will discard the most recently saved data.
The controls on the Sample along line dialog allow you to control some properties of the most recently plotted data. You can change some display settings, interpolation, resolution (number of sample points taken along the line), and whether to normalise the data. By default, the Y axis displays voxel intensities from the sampled image, and the X axis shows the position along the line (typically millimetres). If you are plotting data from different lines, you may find it useful to normalise the data along either the X or Y axes, or to normalise along both axes.
Finally, the ![]() button allows you to save the current plot as an
image (e.g. .png), and the
button allows you to save the current plot as an
image (e.g. .png), and the ![]() button allows you to
save the data from one sample line to a plain text file.
button allows you to
save the data from one sample line to a plain text file.
Seed correlation

The Seed correlation tool is active when a 4D image is selected. When you select this tool, it will calculate Pearson’s correlation coefficient between the time series of the voxel at the current location, and the time series of all other voxels. When the calculation is complete, a correlation map will be added as a new overlay.
You can then select a different location and re-run seed correlation. The correlation map will then be updated with the correlation values for the new location.
Lightbox view tools
Choose lightbox slices
The default method for controlling the slices that are displayed in a lightbox view involves setting the Z range and slice spacing as proportions, between 0 and 1, of the full image range. The Choose lightbox slices tool gives you another option, to control the displayed slices according to the voxel coordinates of an image.

The dialog allows you to choose the image and Z axis, and to specify the start and end slices, and slice spacing, all in terms of voxels, rather than proportions.
When you select an image in the Choose lightbox slices dialog, it will automatically select that image, and set it as the display space, which ensures that the displayed slices are parallel to the image voxel Z axis. The dialog will also set the Sample slices at setting to Start, which ensures that the starting slice you have chosen will stay the same, regardless of the slice spacing.
Note
What does the Sample slices at setting do?
Internally, the FSLeyes lightbox view divides the Z axis of the display coordinate system into equally sized slices, which are defined in a “slice coordinate system”, having range 0 to 1 where 0 corresponds to the minimum Z value, and 1 corresponds to the maximum.
The number of lightbox slices, and size of each slice, is controlled by the slice spacing setting, and the slices which are actually displayed are controlled by the Z range setting.
By default, the data that is displayed on each slice is taken from the centre of that slice - this is depicted in the diagram below (click to see a larger version):
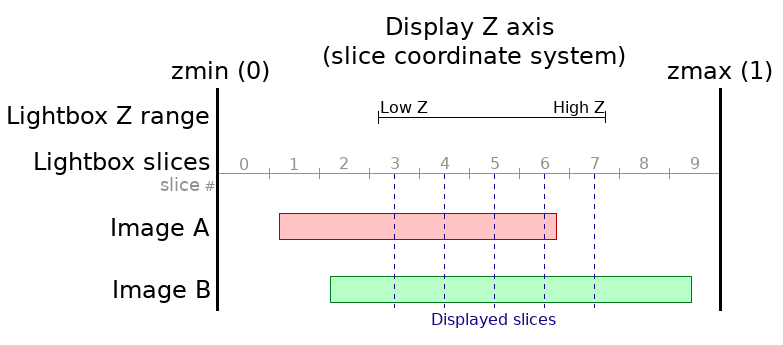
Changing the the Sample slices at setting is to start has two effects:
The slice coordinate system is divided up in such a way that the low Z range will be lined up with the beginning of a slice.
The data that is displayed on each slice is taken from the start of that slice.
This is depicted below (click for a larger version):

Settting Sample slices at to start has the effect that the starting slice (the low Z range) will always display the same data, regardless of the current slice spacing.
Time series view tools

The time series view currently has a single tool, the Add time series from ROI tool. This tool is active when the currently selected overlay is a 4D image, and one or more other images, which are in the same space as the selected image [*], are also loaded.
When you select a mask and click the Ok button, FSLeyes will calculate the mean time series from the selected image, of all voxels which are in the mask. If the mask is non-binary, you can also choose to calculate a weighted mean by selecting the Calculated weighted mean checkbox.
The mean time course will then be added to the time series view.
Histogram view tools
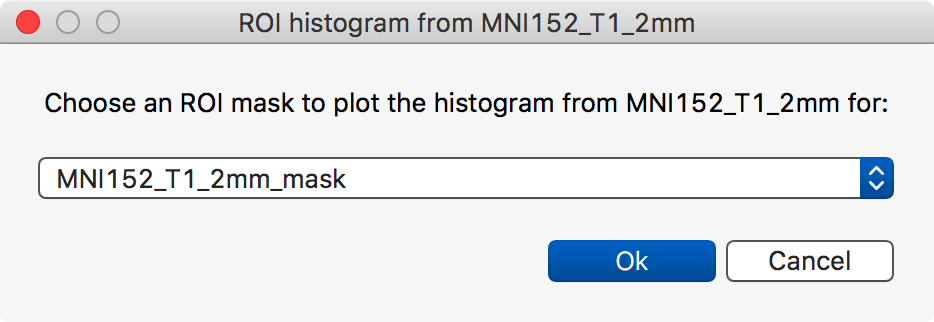
The histogram view has a similar tool which allows you to calculate the histogram of a region within an image, where the region is specified by a binary mask.